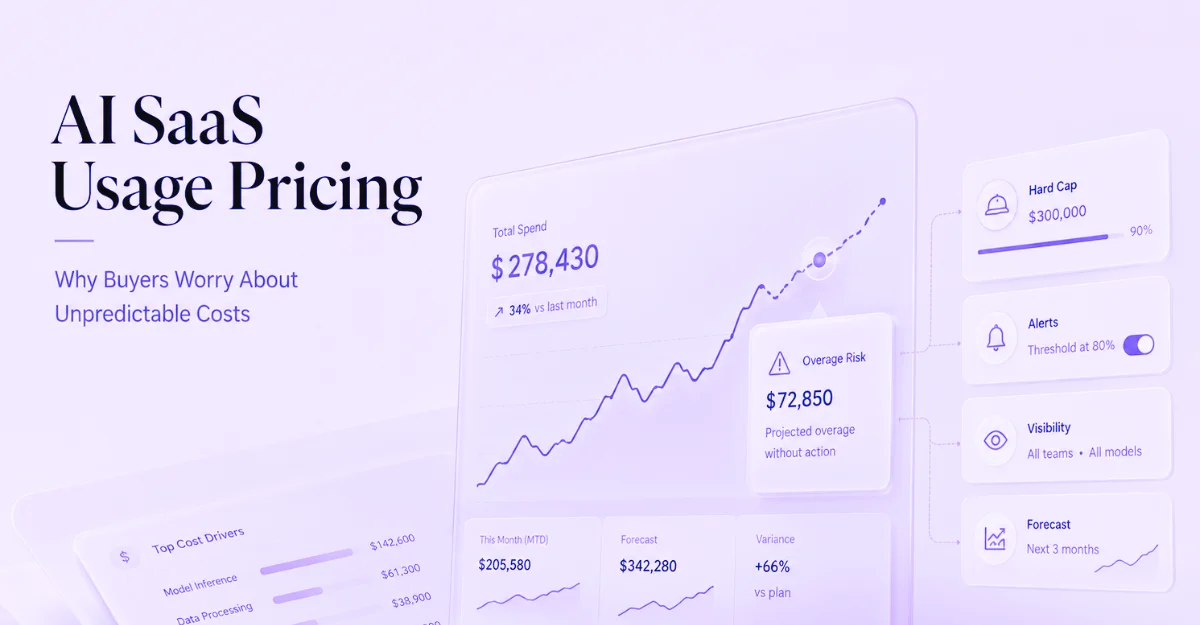
Overview of the AI SaaS Usage Pricing Problem
AI SaaS usage pricing is not just a pricing issue. It is a buyer-control issue.
This report analyzes why AI SaaS usage pricing creates buyer friction and introduces the IVVORA AI Pricing Predictability Score, based on a structured public audit of 82 AI SaaS and AI-enabled SaaS vendors conducted May 15–June 20, 2026.
The analysis finds that the dominant buyer issue is not usage-based pricing itself but the absence of publicly visible governance controls such as hard caps, usage dashboards, spend alerts, forecasting, and overage transparency.
Why do AI SaaS buyers worry about usage pricing?
AI SaaS buyers worry because token-, credit-, API-call, and agent-based pricing can scale with adoption before finance, procurement, and IT have enough visibility, caps, alerts, or forecasting to govern spend.
The issue is unmanaged financial exposure
The core problem in AI SaaS pricing is not usage-based pricing itself. It is unmanaged financial exposure caused by unclear metrics, weak caps, poor visibility, and incomplete governance tooling.
What is the AI SaaS pricing governance gap?
The AI SaaS pricing governance gap is the difference between how dynamically AI usage costs accrue and how predictably buyers need to approve, monitor, cap, and defend software spend.
Need a sharper read on your market?
I help teams turn competitor movement, buyer behavior, platform shifts, and public business signals into clearer strategic decisions.
What creates AI SaaS usage pricing risk?
AI SaaS usage costs are hard to forecast, cap, monitor, and defend internally.
Buyers, CFOs, procurement, IT, business sponsors, and smaller AI SaaS vendors.
Token, credit, API-call, agent-run, and workflow-based pricing without enough governance controls.
Visibility, caps, alerts, forecasting, overage clarity, and contract protection.
In an 82-vendor audit, only 22% disclosed self-serve hard caps and 29% explained overages clearly.
This report measures how governable AI SaaS pricing is before purchase.
Most AI pricing commentary explains why usage-based pricing exists. This report measures whether buyers can understand, monitor, cap, and forecast AI SaaS usage before purchase.
The AI Pricing Predictability Score turns public pricing pages into a buyer-facing benchmark for usage clarity and cost-control maturity.
What the benchmark measures
Measures
- Public pricing clarity
- Publicly visible controls
- Buyer-facing predictability
- Governance documentation
- Pre-purchase explainability
Does not measure
- Private enterprise contract quality
- Actual product performance
- Customer satisfaction
- Vendor financial health
- Internal-only admin features
Data sources used for this AI SaaS pricing research
82-vendor public pricing and documentation audit conducted May 15–June 20, 2026.
Third-party SaaS spend research, including the Zylo 2026 SaaS Management Index.
AI FinOps guidance from the FinOps Foundation.
Public review signals from G2, Capterra, and TrustRadius used as qualitative context only.
Public pricing and documentation pages from OpenAI, Anthropic, Cursor, GitHub Copilot, Replit, Perplexity, Notion AI, Glean, Intercom Fin, Zendesk AI, and 72 additional vendors.
AI pricing risk is moving from pilots into production budgets.
AI features are moving from pilots to production. More vendors are layering usage-based AI on seat plans. Agentic workflows increase background consumption. Finance teams are being asked to control AI spend. Procurement is adapting old SaaS processes to new usage models. Smaller vendors need governance credibility earlier in the funnel.
What Are Unpredictable AI SaaS Usage Costs?
AI SaaS pricing becomes harder to predict when buyers cannot clearly see what is metered, when usage resets, what triggers overages, and which controls limit spend.
Cost tied to input/output tokens processed.
Abstract units consumed by actions, generations, or model calls.
Metered per request, workflow step, or autonomous execution.
Base subscription plus usage above included allowance.
Charges after included usage is exhausted.
Enforceable stop or automatic block at a defined threshold.
Warning or throttling; usage can still exceed.
Visibility by user, team, workflow, model, or customer.
Tools or data to predict future spend from current patterns.
Full glossary published separately.
How is AI SaaS usage pricing different from traditional SaaS pricing?
Traditional SaaS pricing was easier for buyers to budget because cost usually followed seats or instances. AI SaaS usage pricing moves the buyer’s concern toward usage intensity, model consumption, and control visibility.
Seat or instance count
High — finance can annualize
Seat benchmarking
Often neutral or decreases
Mature
Clear line items
Usage intensity and model consumption
Variable — scales directly with adoption
Evaluation of controls and visibility
Can directly increase spend
AI-specific controls less consistently disclosed on public pages
Decentralized, delayed, model-dependent
How buyers become exposed to unpredictable AI costs
Buyer predictability risk rises when usage is variable, pricing units are abstract, caps are weak, reporting is delayed, and ownership is unclear.
How AI usage costs affect vendor margins
Vendor margin exposure = customer usage intensity × upstream model-cost volatility − ability to pass costs through predictably.
Evidence Behind the AI SaaS Pricing Problem
The article’s argument rests on a mix of original IVVORA benchmark data, third-party research, and analyst interpretation on how unpredictable AI usage costs change buyer behavior.
of audited vendors publicly disclosed self-serve hard caps.
of IT leaders reported unexpected charges tied to consumption-based or AI pricing models.
of companies had a comprehensive view of AI costs.
Hard caps are still rarely disclosed.
Only 22% of the 82 audited vendors publicly disclosed self-serve hard caps.
Benchmark dataset, hard_cap_public column, May 15–June 20, 2026.
Unexpected AI and consumption charges are common.
Zylo’s 2026 SaaS Management Index found that 78% of IT leaders reported unexpected charges tied to consumption-based or AI pricing models; 61% had to cut planned projects.
AI cost visibility remains incomplete.
A KPMG survey cited in Wall Street Journal reporting found that only 26% of companies have a comprehensive view of AI costs.
AI spend needs real-time monitoring and controls.
FinOps Foundation guidance recommends real-time tracking, quotas, tagging, and alignment of AI cost monitoring to business outcomes.
Unpredictable usage costs increase procurement scrutiny.
As AI usage costs become less predictable, finance and procurement teams are more likely to require spend caps, usage reporting, and renewal protections before expansion.
AI SaaS Pricing Benchmark 2026
How the AI SaaS Pricing Benchmark was created
IVVORA reviewed public pricing pages, billing documentation, help centers, and plan comparison pages for 82 vendors between May 15 and June 20, 2026.
vendors reviewed
vendor categories
scoring criteria
Vendor categories and counts
AI-native applications
AI devtools and coding assistants
Vertical AI SaaS
AI infrastructure/API platforms
Embedded-AI in productivity, CRM, and collaboration tools
What was included and excluded
Publicly accessible pricing and documentation pages.
Private enterprise contract terms unless publicly referenced.
Each of the 10 criteria scored 0 or 1 point. No partial scoring.
If a feature was mentioned in marketing copy but not explained in public pricing, billing, or admin documentation, it received no credit.
How public documentation was scored
Public pages reviewed
Pricing pages, billing documentation, help centers, and plan comparison pages were reviewed.
One analyst scored each vendor
Each vendor was scored against the 10-criterion rubric using only public information.
Second-pass source review
Scores were reviewed again against source URLs. Disputed cases required public documentation rather than marketing claims.
Source URLs recorded
Vendor pages were not archived as screenshots, but source URLs were recorded for review.
What this benchmark can and cannot prove
Private enterprise contracts may include controls not visible publicly.
Product dashboards may include features not mentioned on pricing pages.
Public-page clarity is not the same as product quality or customer satisfaction.
Scores may change quickly as vendors update pages.
Category definitions affect averages.
Enterprise-only vendors may appear weaker publicly than they perform privately.
The benchmark measures buyer-facing pricing governance documentation, not internal product capabilities or satisfaction.
How AI SaaS pricing controls were scored
Each criterion was scored as either present or absent based on public pricing, billing, or admin documentation.
Publicly defines usage metric
Shows included usage with examples
Explains overage behavior and rates
Provides hard-cap option
Provides soft-cap / alert visibility
Provides admin usage dashboard
Breaks usage down by user/team/workflow/model
Explains model-tier consumption differences
Provides forecasting or estimator
Provides contract/procurement guidance or FAQ
AI SaaS pricing score categories
High Unpredictability Risk
Moderate Governance Gap
Buyer-Ready
Enterprise-Grade Predictability
How AI SaaS vendors scored on pricing predictability
AI SaaS pricing scores by vendor category
AI Infrastructure/API platforms
- n: 12
- Strongest control: Dashboards & model transparency
- Weakest control: Hard caps on standard plans
- Buyer risk: Complex pass-through pricing
AI Devtools
- n: 15
- Strongest control: Included usage clarity
- Weakest control: Forecasting & hard caps
- Buyer risk: Power-user overage spikes
Vertical AI SaaS
- n: 18
- Strongest control: Basic credit disclosure
- Weakest control: Overage clarity & caps
- Buyer risk: Procurement language gaps
Embedded-AI in productivity/CRM
- n: 15
- Strongest control: Core dashboard
- Weakest control: AI-specific visibility
- Buyer risk: AI layer bolted onto seat plans
AI-native applications
- n: 22
- Strongest control: Workload examples
- Weakest control: Credit definition clarity
- Buyer risk: Buyer confusion on burn rate
AI SaaS pricing examples from the public benchmark
These examples show how public pricing models, control visibility, and buyer-facing documentation vary across vendor categories.
Category: AI Infrastructure/API
Pricing model: Token-based
Usage metric: Input/Output tokens per 1M
Controls: Included usage disclosed, pay-as-you-go overage, partial hard cap, admin dashboard, limited forecasting, model differences explained.
Source: platform.openai.com/docs/pricing · Checked 2026-06-20
Evidence note: Strong visibility; hard caps not fully self-serve on standard plans.
Category: AI Infrastructure/API
Pricing model: Token-based
Usage metric: Tokens per model
Controls: Included usage disclosed, pay-as-you-go overage, limited hard cap, admin dashboard, no forecasting, model differences explained.
Source: docs.anthropic.com · Checked 2026-06-20
Evidence note: Excellent rate limits; caps often require third-party tools.
Category: AI Devtool
Pricing model: Credit-based
Usage metric: Dollar-equivalent credits
Controls: Included usage disclosed, overage billed in arrears, no public hard cap, admin dashboard, no forecasting, model differences explained.
Source: cursor.com/pricing · Checked 2026-06-20
Evidence note: Good dashboard; overage communication improved post-2025.
Category: AI Research/Productivity
Pricing model: Hybrid
Usage metric: Credits + subscriptions
Controls: Partial included usage disclosure, partial overage visibility, hard cap varies, improving dashboard, emerging forecasting, model differences explained.
Source: perplexity.ai/pricing · Checked 2026-06-18
Evidence note: Newer entrants showing better controls.
Category: Embedded-AI in Productivity
Pricing model: Add-on credits
Usage metric: AI credits on seat plan
Controls: Partial included usage disclosure, often vague overage visibility, rare public hard cap, limited dashboard, no forecasting, partial model differences.
Source: notion.so/pricing · Checked 2026-06-18
Evidence note: AI layer added without full governance parity.
Category: Vertical AI SaaS
Pricing model: Hybrid
Usage metric: Resolution/automation credits
Controls: Partial included usage disclosure, often “contact sales” overage visibility, rare public hard caps, limited dashboard, no forecasting, partial model differences.
Source: Benchmark methodology · Checked 2026-06-20
Evidence note: Credit definition frequently vague across 18 vendors.
Category: AI Devtool
Pricing model: Credit/usage-based
Usage metric: Model usage credits
Controls: Included usage clearer in newer entrants, overage visibility improving, hard caps vary, dashboards present in leaders, forecasting absent in most, partial model differences.
Source: Benchmark methodology · Checked 2026-06-20
Evidence note: Dashboard presence rising but caps lag across 15 vendors.
Category: AI Infrastructure/API
Pricing model: Consumption-based
Usage metric: Tokens/compute units
Controls: Included usage visible at infrastructure layer, complex pass-through overage, enterprise-only hard caps, strong dashboards, forecasting, model differences explained.
Source: Benchmark methodology · Checked 2026-06-20
Evidence note: Infrastructure-native vendors score higher due to existing predictability culture.
The full 82-vendor benchmark table, data dictionary, methodology details, and downloadable CSV are published as a separate crawlable asset at /ai-saas-pricing-governance-benchmark-2026/ and updated quarterly. All vendor scores include source URLs and last-checked dates.
AI SaaS pricing control maturity levels
Vague Usage
Credits/tokens mentioned but undefined.
Visible Usage
Included units and overage rules disclosed.
Monitored Usage
Dashboards and alerts available.
Controlled Usage
Hard caps, team-level limits, admin controls.
Forecastable Usage
Forecasting, calculators, chargeback support, contractual protections.
How Unclear AI SaaS Pricing Slows Buyer Decisions
How unclear AI SaaS pricing slows buyer decisions
Unpredictable usage pricing creates a chain reaction across finance, IT, procurement, and leadership. The issue starts with unclear usage rules and ends as delayed approval.
Usage cannot be modeled
- Unclear metric
- Cannot model usage
- Cannot forecast burn
- No hard cap
Governance risk appears
- Finance sees open exposure
- No admin granularity
- IT sees governance risk
- No overage clarity
Approval slows down
- Procurement sees contract ambiguity
- No reporting
- Leadership cannot assign accountability
- Deal slows or stalls
What CFOs, procurement, IT, and users ask about AI SaaS pricing
Each stakeholder sees the same pricing model through a different risk lens. The more unclear the controls, the more people enter the decision.
Budget exposure
Can this exceed budget without approval? How do we forecast and provision for it?
Contract control
Where is the contractual cap, overage clause, and renewal protection?
Governance visibility
Can admins monitor and restrict usage by team, user, workflow, model, and data sensitivity?
ROI defensibility
Can I prove ROI without being blamed for cost spikes?
Usage confidence
Will heavy legitimate use trigger throttling or internal blame?
Why AI agents make SaaS usage costs harder to predict
Agentic workflows introduce retries, tool calls, long-context growth, and background or scheduled execution that can cause token and tool-call consumption to vary significantly because these add consumption paths that do not exist in simple seat-based or single-prompt SaaS.
Failed or incomplete steps can trigger additional model calls.
External actions add consumption outside the first prompt.
More context can increase token use as workflows expand.
Scheduled or autonomous tasks can consume usage without direct user awareness.
AI agents turn usage from a visible user action into a background operating cost. That makes caps, dashboards, alerts, and reporting more important before adoption scales.
What an AI SaaS Pricing Page Should Include
A strong AI SaaS pricing page does more than show the plan price. It gives buyers enough information to understand, forecast, cap, and defend usage-based spend before purchase.
Plan price
Included usage
Usage metric definition
Workload examples
Overage rule
Cap options
Alerts and dashboard
Model-tier differences
Forecasting / calculator
Procurement FAQ
Billing docs link
Renewal / true-up language
Examples of weak and strong AI SaaS pricing pages
Buyers do not only compare price levels. They compare how clearly each vendor explains usage, overages, caps, dashboards, and forecasting.
Contract terms buyers ask for in AI SaaS pricing
When usage pricing is unclear, buyers often push for commercial protections that turn variable spend into a more governable operating expense.
How unpredictable AI SaaS pricing affects the sales process
Usage-cost uncertainty does not stay inside the pricing page. It moves through discovery, technical evaluation, procurement, legal, finance, expansion, and renewal.
Buyer asks about usage metric early.
Power users generate unpredictable consumption.
Overages and caps become blockers.
Contract protection requested.
Budget owner asks for maximum exposure.
Adoption increases cost anxiety.
Surprise usage becomes churn or discount pressure.
Questions Buyers Should Ask Before Approving AI SaaS Pricing
These questions turn usage-based pricing from a vague cost concern into a structured procurement review.
What exact unit is metered?
Can usage exceed plan limits automatically?
What is the maximum possible monthly exposure?
Can we enforce a hard cap?
Can caps be set by workspace, team, project, or user?
Are alerts real-time?
Can finance receive automatic reports?
Are agent runs metered separately?
Are retries billed?
Are failed generations billed?
Do different models burn credits differently?
Can we export usage data?
What happens at renewal if usage spikes?
Can we add contractual spend protection?
Is there a dedicated finance/procurement FAQ?
How AI SaaS vendors can improve pricing controls
The control layer should mature with the buyer segment. Self-serve buyers need basic limits. Enterprise and regulated buyers need stronger governance infrastructure.
Basic usage control
Usage definition, alerts, hard cap.
Admin-level visibility
Admin dashboard, team-level limits, overage visibility.
Finance-ready governance
Contract cap, forecasting, exportable reports, chargeback support.
Audit-ready controls
Audit logs, approval workflows, data-sensitive controls.
What buyers risk when AI SaaS pricing is unclear
What vendors risk when pricing controls are weak
Early warning signs of AI SaaS pricing friction
Pricing friction usually appears in public signals before it shows up as churn, discounting, or stalled sales cycles.
Competitor adds cap language
What it signals: Buyer expectation shifting
Lagging outcome: Deal friction rises
Reviews mention billing confusion
What it signals: Post-sale trust risk
Lagging outcome: Churn / discounting
RFP asks for usage governance
What it signals: Procurement formalization
Lagging outcome: Longer sales cycle
Job posts mention AI FinOps
What it signals: Spend oversight becoming role-owned
Lagging outcome: More approval layers
Vendor adds calculator
What it signals: Market education improving
Lagging outcome: Weak pages look immature
What Smaller AI SaaS Companies Should Do About Usage Pricing
Smaller vendors must treat cost predictability as core product and GTM infrastructure. This directly affects pricing structure decisions, roadmap priority for visibility and controls, sales enablement playbooks, customer segmentation by FinOps maturity, and infrastructure diversification strategy.
Make included usage, overages, caps, and true-up logic easier to understand before purchase.
Prioritize dashboards, alerts, forecasting, and admin controls as buyer-facing infrastructure.
Equip GTM teams to answer finance, procurement, and IT questions before pricing becomes friction.
Map buyer sensitivity by FinOps maturity, governance expectations, and approval complexity.
Reduce margin exposure by tracking upstream model-cost volatility and pass-through predictability.
What AI SaaS pricing signals to track next
Public pricing and documentation signals often reveal buyer expectations before the pressure appears in win rates, churn, or discounting.
Updates adding dashboards, caps, alerts, or calculators.
G2, Capterra, and TrustRadius mentions of billing predictability or usage confusion.
Buyer requirements for usage governance, spend controls, and reporting.
AI FinOps, SaaS cost management, or usage analytics roles appearing in target accounts.
Provider updates to monitoring, limits, metering, or pricing that affect downstream margin exposure.
Is usage-based AI SaaS pricing always a problem?
Usage-based pricing can be fair economically and still fail operationally. The buyer objection is not always economic unfairness — it is operational unpredictability without governance infrastructure.
What this AI SaaS pricing research does not claim
AI SaaS buyers are not afraid of usage. They are afraid of unmanaged usage.
The winners in AI SaaS pricing will not be the vendors that make usage invisible. They will be the vendors that make usage governable.
IVVORA research standards for AI SaaS pricing analysis
Public methodology, disclosed limitations, corrections policy, and quarterly updates.
v1.0 — June 22, 2026: Initial 82-vendor benchmark, scoring rubric, maturity model, and public dataset published.
Vendors may submit public documentation links for review. IVVORA will not revise scores based on private sales claims, screenshots behind login, or undocumented assertions. Accepted corrections will be logged in version history.
Sources used for this AI SaaS pricing research
Zylo 2026 SaaS Management Index — Unexpected charges and AI spend surge — Accessed June 22, 2026
Wall Street Journal / KPMG AI cost visibility survey, 2026 — Accessed June 22, 2026
Anthropic Console documentation — Usage, rate limits, monitoring — Accessed June 22, 2026
Cursor pricing and documentation — Credit-based model and dashboard — Accessed June 22, 2026
OpenAI API pricing documentation — Token-based structure — Accessed June 22, 2026
FinOps Foundation AI cost monitoring guidance — Accessed June 22, 2026
Public pricing pages of 82 vendors in benchmark cohort — May–June 2026
Use this benchmark to evaluate AI SaaS pricing risk before it becomes deal friction.
IVVORA uses this public benchmark and frameworks to help smaller AI and SaaS companies evaluate pricing governance gaps, competitor controls, and buyer-friction risks in their category before cost unpredictability becomes a deal blocker or margin issue.
Contact Samarthya for private category deep-dives, ICP-specific exposure scoring, or competitor tracking built on top of the public benchmark. The full 82-vendor dataset, methodology, and CSV are publicly available at the linked benchmark page.