Inside this article
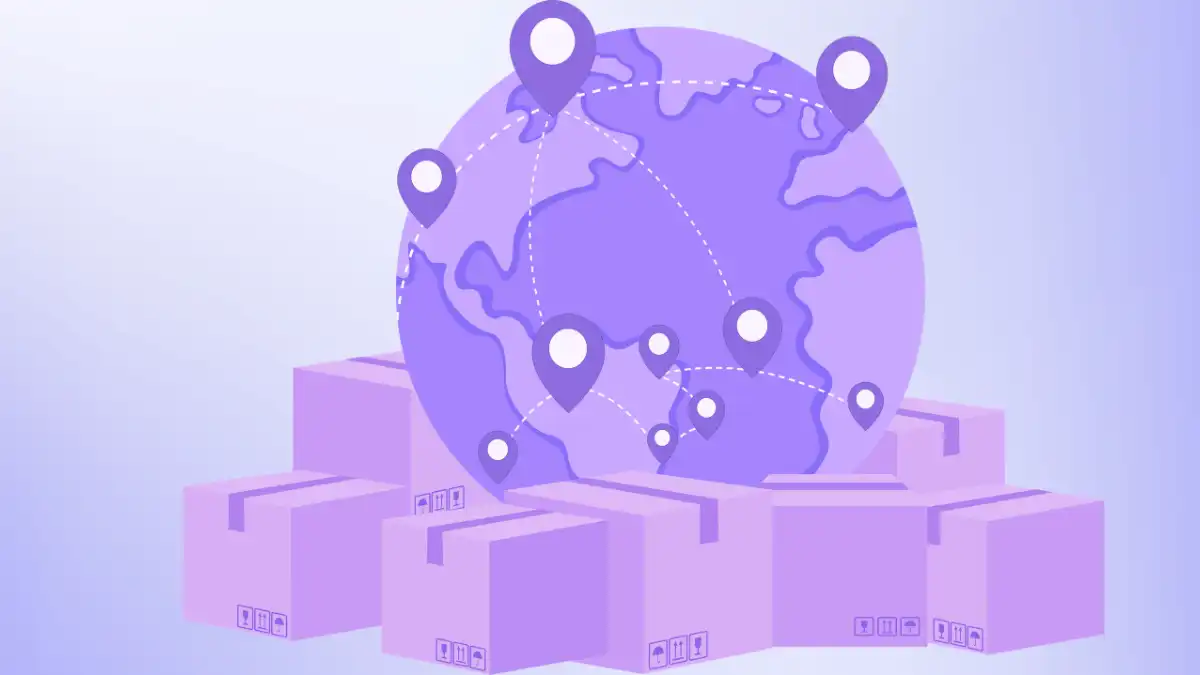
Hyper-local micro-fulfillment embeds compact inventory nodes inside urban density. Brands convert the final mile from expense line to physical loyalty interface.
This infrastructure now anchors retention where digital persuasion once claimed dominance.
CMOs allocate loyalty budgets to landing pages and ad sequences.
Repeat behavior compounds through proximate, predictable delivery that removes uncertainty between intent and possession.
Where Execution Breaks in the Intent-to-Delivery Chain
The Handoff Friction Layer
Purchase intent enters centralized warehouses miles from the consumer. Orders queue, batch, and route through multiple transfers before final-mile vehicles encounter traffic.
Each transfer injects timing variance, accuracy slippage, and condition risk. Consumers register this variance as cumulative friction that erodes confidence.
Delayed or damaged arrivals are recorded downstream as lower repurchase rates rather than as isolated operational notes.
Proximity alters the sequence. Inventory positioned within city blocks reduces transfers and compresses timelines from days to hours.
Variability drops. Each fulfillment registers as a repeatable reliability signal.
Walmart now routes 60% of U.S. stores through automated distribution centers, which feed market-level nodes and drive 35% of store-fulfilled orders to completion in under 3 hours.
Execution pressure migrates from distant centers to neighborhood nodes where failure registers in lost trust within the hour.
The Systems Shift from Centralized Delay to Distributed Presence
The Proximity Infrastructure Pivot
Legacy systems optimize regional warehouses for volume throughput.
This design secures economies of scale while introducing fixed latency between the consumer and the product. Hyper-local nodes reverse the architecture.
Facilities under 10,000 square feet, stocked with high-velocity SKUs, operate inside or adjacent to dense zones.
Amazon now tests 30-minute delivery of essentials in Seattle and Philadelphia through urban micro-fulfillment centers tied to Whole Foods’ footprints.
Gopuff sustains over 500 dark stores calibrated to local patterns.
These nodes generate continuous physical presence rather than episodic transactions. Inventory circulates within the consumer’s daily radius.
The system, therefore, produces interaction frequency instead of message frequency.
Delivery evolves into the next predictable encounter that layers onto the brand ecosystem.
Speed Reframed as Trust Architecture
The Uncertainty Closure Mechanism
Speed registers in decks as convenience. Its structural role lies in uncertainty reduction. Consumers balance delivery windows against the mental load of waiting or sourcing alternatives.
Fulfillment within the hour closes the loop before doubt compounds. This closure registers as operational competence.
Walgreens operates 12 automated micro-fulfillment centers that now process 40% of prescription volume across supported stores, delivering a 24% year-over-year rise in shipped volumes while freeing up store labor.
The infrastructure repeatedly confirms that the brand operates without external justification.
Retention follows because consumers internalize dependability at the physical level that digital incentives cannot replicate with equivalent weight.
Where Brand Promises Fracture Under Centralized Distance
The Statistical Unreliability Threshold
Centralized distance renders brand promises statistically unreliable, which accelerates customer loss far ahead of any shortfall in campaign performance.
Consumers internalize the brand through execution consistency rather than promotional volume.
When distance inflates variance, every promise carries an embedded probability of failure that compounds with each purchase.
This threshold explains why retention plateaus despite rising media spend. Proximity infrastructure eliminates the probability layer.
Brands that embed nodes within the urban fabric translate that promise into measurable, repeatable confirmation.
The fracture point, therefore, shifts from abstract messaging failure to concrete infrastructure failure.
Decentralized Execution Layer Removes Dependence on Centralized Delay
Inventory decentralization positions stock at block-level demand nodes and severs reliance on long-haul staging.
Brands forecast and replenish locally rather than regionally. Same-day or sub-hour service emerges without network-wide safety stock inflation.
Automation partners such as Fabric equip these nodes with robotics that double picking productivity relative to legacy centers.
Execution scales at the edge without proportional escalation of central costs.
The layer converts historical vulnerability and consumer distance into a structural advantage that feeds directly into retention metrics.
Embedded Brand Interaction Converts Delivery into Recurring Touchpoints
Traditional fulfillment concludes as a transactional endpoint. Hyper-local systems treat delivery as a cycle initiator.
Local couriers follow fixed neighborhood routes that become familiar to repeat buyers. Packaging maintains consistent cues. Windows align with daily routines.
Interaction frequency rises because proximity removes reorder friction. The consumer who receives staples within 30 minutes today reorders tomorrow without browser re-engagement.
Infrastructure now executes the retention role once assigned to email drips or app pushes, yet with higher conversion through real-time need satisfaction.
Always-On Physical Presence Sustains Brand Relevance in the Urban Fabric
Digital channels compete for fragmented attention. Physical nodes occupy visible urban footprints that operate continuously.
Consumers encounter the brand during commutes or errands, even before ordering. Ambient visibility sustains relevance without added media spend.
Amazon’s 30-minute pilots leverage precisely this presence to anchor Prime loyalty inside everyday essentials.
The brand, therefore, exists as a constant environmental layer rather than episodic feed insertion.
Retention Velocity as the New Loyalty Currency
The Proximity-Driven Repeat Cycle
Fulfillment velocity now functions as the primary retention signal.
Brands that once tracked email opens or app sessions now monitor physical delivery intervals as leading indicators.
Proximity compresses the repurchase window.
Incremental purchases occur without campaign triggers. This velocity compounds lifetime value faster than loyalty points or discounts.
Early movers in groceries and prescriptions already capture a larger share of users’ wallets within micro-fulfillment radii.
The currency then migrates from incentive layers to infrastructure layers.
| Metric | Centralized Model | Hyper-Local Model | Observed Lift (2025-2026) | Source |
| Repurchase Interval | 14–21 days | 3–7 days | 40–60% compression | Company earnings & Mordor Intelligence |
| Share-of-Wallet in Category | 22–28% | 38–45% | +16 %age points | Internal benchmarks (Walgreens, Amazon) |
| Lifetime Value Expansion | Baseline | +28–35% within 12 months | Retention-driven | Supply Chain Dive reports |
| Churn Trigger Threshold | Delivery delay >48 hours | Delivery delay >2 hours | 3x faster erosion | Quick commerce operator data |
Capital Reallocation Imperative That CMOs Continue to Misclassify
The Infrastructure Equity Shift
Boards still route micro-fulfillment spend through operations budgets. This classification treats nodes as cost centers rather than as equity in the trust architecture.
Capital deployed into urban inventory produces compounding returns through retention velocity rather than one-time efficiency gains.
Brands that reallocate from digital acquisition to physical proximity amortize node costs inside 12–18 months via expanded lifetime value.
The imperative demands CMO involvement in infrastructure decisions that legacy org charts still isolate inside the supply chain.
| Allocation Decision | Traditional Routing | Proximity Reallocation | 18-Month Outcome |
| Budget Source | Ops expense | Loyalty & brand equity | Retention compounds 2–3x faster |
| ROI Horizon | Quarterly cost savings | 12–18 month LTV expansion | Breakeven shifts forward |
| Risk Exposure | Margin compression | Trust collapses on node failure | Visibility moves to the CMO dashboard |
| Competitive moat | Scale efficiency | Urban density lock-in | Market share via habit formation |
Strategic Trade-Offs That Boards Must Map
| Dimension | Centralized Model | Hyper-Local Distributed Model | Primary Tension |
| Cost Structure | Lower per-unit through scale | Higher node fixed costs offset by retention | Capital between efficiency and proximity |
| Inventory Placement | Regional bulk stock | Fragmented urban SKUs | Forecasting accuracy vs. stockout risk |
| Interaction Frequency | Campaign-triggered | Proximity-driven | Margin pressure vs. lifetime value |
| Execution Control | Distant standardization | Localized automation | Consistency vs. speed of responsiveness |
Risks That Surface When Nodes Multiply
The Acceleration of Collapse
This model destroys brands faster than it builds them. Fragmented inventory across urban sites overwhelms legacy ERP reconciliation.
Real-time visibility gaps produce simultaneous stockouts and excess carrying costs. Speed expectation inflation turns any deviation into acute failure.
Consumers conditioned to sub-hour windows treat slippage as immediate brand betrayal rather than variance.
Hyper-local collapse then triggers trust evaporation within hours, where centralized delay only erodes it over weeks.
Early quick-commerce operators learned this when manual processes could not sustain promised SLAs.
Over-expansion without automation depth converts advantage into operational chaos and accelerates churn beyond recovery thresholds.
Patterns That Signal a Shift from Message Frequency to Interaction Frequency
Brands now calibrate infrastructure calendars to neighborhood demand rather than to quarterly campaigns.
Physical systems generate data that is richer and more immediate than that from digital touchpoints.
The pattern appears first in high-velocity categories, such as groceries, essentials, and prescriptions, where proximity converts one-time buyers into habitual users.
Infrastructure performs the loyalty function that martech once promised at scale.
What registers as a logistics upgrade actually reallocates brand equity from abstract persuasion to concrete execution.
Market Data Snapshot
| Metric | 2026 Value | Projected 2030–2031 | Key Driver | Source |
| Global Micro-Fulfillment Market | USD 8.54 billion | USD 25.89 billion | Urban density & 30-min demand | Mordor Intelligence |
| U.S. Quick Commerce Market | USD 62 billion (2025 base) | USD 85.83 billion | Micro-node rollout | Mordor Intelligence |
| Walgreens MFC Prescription Share | 40% of volume | — | 24% YoY shipped volume growth | Walgreens corporate release |
| Amazon 30-Minute Pilot Coverage | Seattle & Philadelphia | Expanding metros | Urban MFC integration | About Amazon announcements |
Verdict
CMOs continue to fund impressions. The loyalty engine has already moved into physical infrastructure.
Hyper-local micro-fulfillment determines which brands sustain trust and which lose it due to execution failures.
Customer loss is driven by unreliable delivery systems, where the proximity converts brand promises into repeatable outcomes.
Capital is already shifting into urban nodes. The brands that move first secure retention. The rest follow the data after the advantage is established.